
How to Create Insightful Power BI Reports in 10 Steps
There is a wide range of good choices when it comes to BI solutions in the market from top tech companies (SAP, Microsoft, Oracle, SAS, IBM, Salesforce, etc.), each coming with their own range of features and perks for a customer. Let’s consider Microsoft Power BI as one of the most effective yet intuitive BI solutions to get started with. Find out how to create actionable reports within this platform using some Power BI recommendations we share below.
How to Create Visual Reports – Power BI Best Practices
Microsoft Power BI is a business intelligence platform that allows you to gather your data from multiple sources, analyze and visualize it in the form of power BI reports, and find data-supported answers to the questions essential for your business.
Here are some recommendations on how to create the best power BI dashboards to evaluate the trends and dynamics, find the root causes of business-essential changes, instantly catch anomalies, and suggest better growth strategies, all while being data-driven:
Data Gathering
Gathering, classifying, and structuring data properly are essential processes for creating insightful Power BI reports. Depending on the data you have, you can realize a lot of dashboard ideas. Here is how to do it:
- Step 1. Design a correct data model. The quality of your analytics highly depends on the way you organize your data – a data model. Properly selected modeling allows for structuring vast amounts of information to help retrieve valuable insights while enabling faster, more efficient processing and higher accuracy. Depending on the report requirements and the complexity of the dashboard, you can opt for the star or snowflake schemas as the most common ones.
- Step 2. Integrate Power BI with the most essential apps. The list of the apps that can be integrated with Microsoft Power BI is almost endless. The platform supports most of the apps modern businesses need, including but not limited to such use cases as sales and procurement, marketing and HR, development and operations, plus cloud storage and databases. However, to keep your power BI reports meaningful and fast, there is no need to integrate them all. Integrate only those apps that generate the most important data for your business.
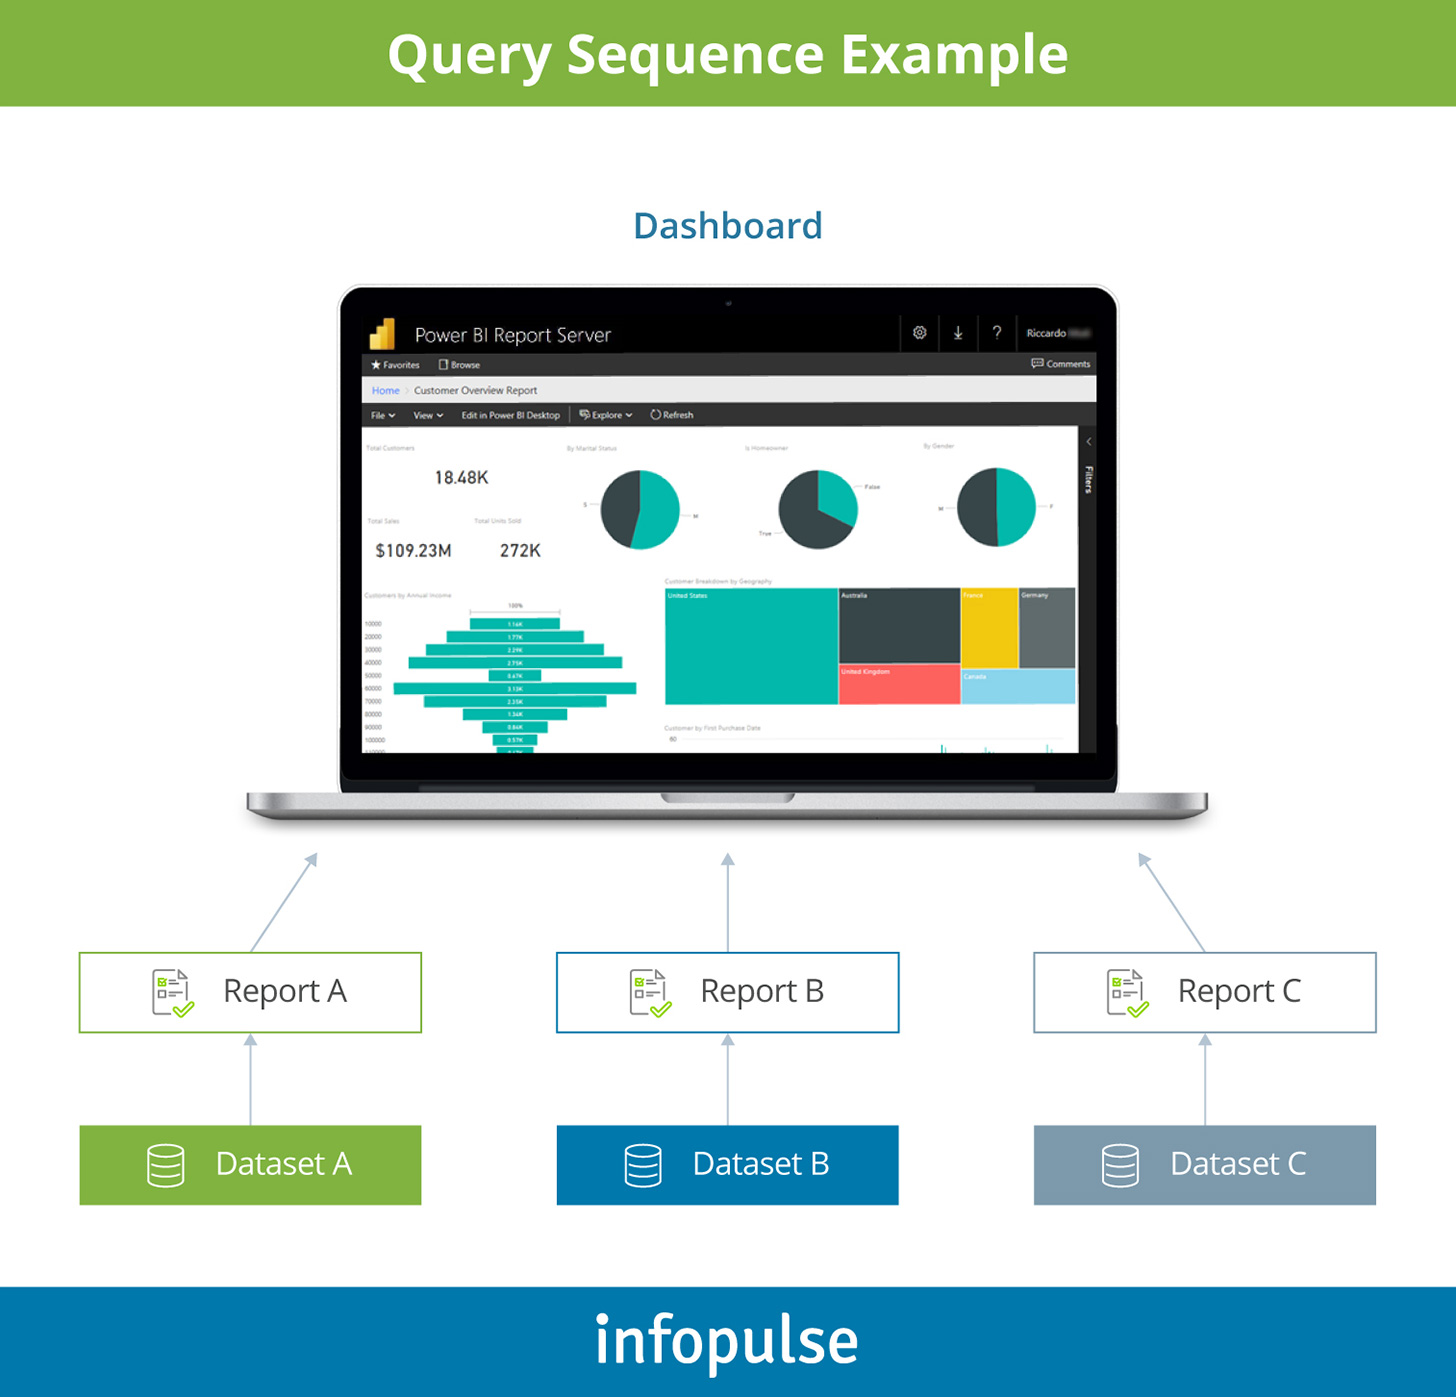
- Step 3. Reduce the number of queries. If you want to make your report loading fast and easy to interact with, you should handle the growing volume of queries. Although Power BI can send as many queries to different datasets as you need, it is better to reduce them to the most essential data sources to avoid overloading your report and decreasing its loading speed.
Data Security
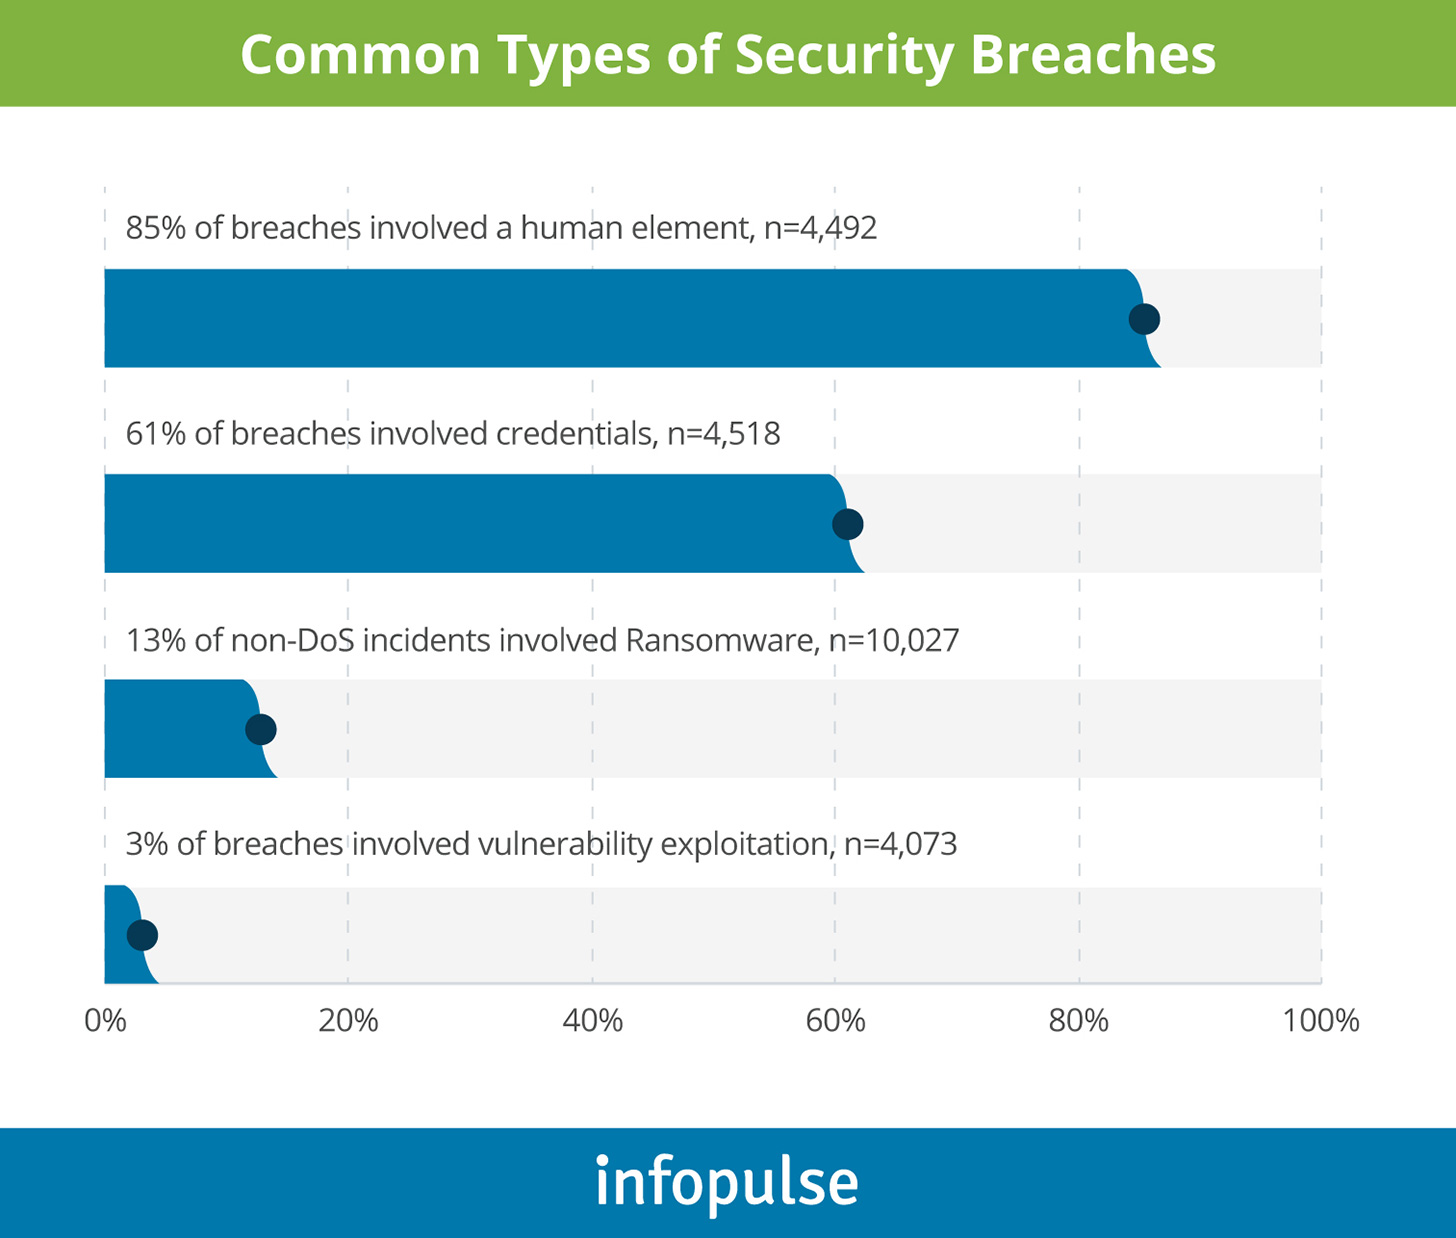
Data breach costs rose from $3.86 million to $4.24 million, the highest average total cost in the 17-year history of the report IBM creates annually. This is a strong enough reason to store your data safely and control access to it.
- Step 4. Store your reports safely. Fortunately, Microsoft Power BI allows for storing the reports right on the server. Still, you can choose additional options and transfer your data to your cloud storage, or wherever else it will be safe.
As one of the most secure cloud data storage strategies, consider mixing multiple public and private cloud storage — 43% of companies surveyed by Flexera store their valuable data in this way.
A case in point: discover how Infopulse helped a travel retail company speed up reporting and enable ad-hoc adjustments with a DWH based on MS SQL Server with Master Data Service to reliably maintain their critical financial data. - Step 5. Limit data access by role. The best Power BI dashboards are sensitive since they very often show the opportunities for business growth and hint at the winning strategies you can use to drive your company.

According to Verison, 60% of data breaches happen because of the misuse of credentials. That’s why it is necessary to control access to the most sensitive information by role and by level — you can set this up in Power BI as well.
Visual BI Dashboard Design
There are a lot of dashboard ideas you can realize in Power BI, making reports understandable, recognizable, and eye-catching.
- Step 6. Add some branding. Adding branded elements and using corporate colors is one of the Power BI dashboard ideas worth exploring. It makes your reporting instantly recognizable and helps with developing an associative bond between a brand and the recipient.
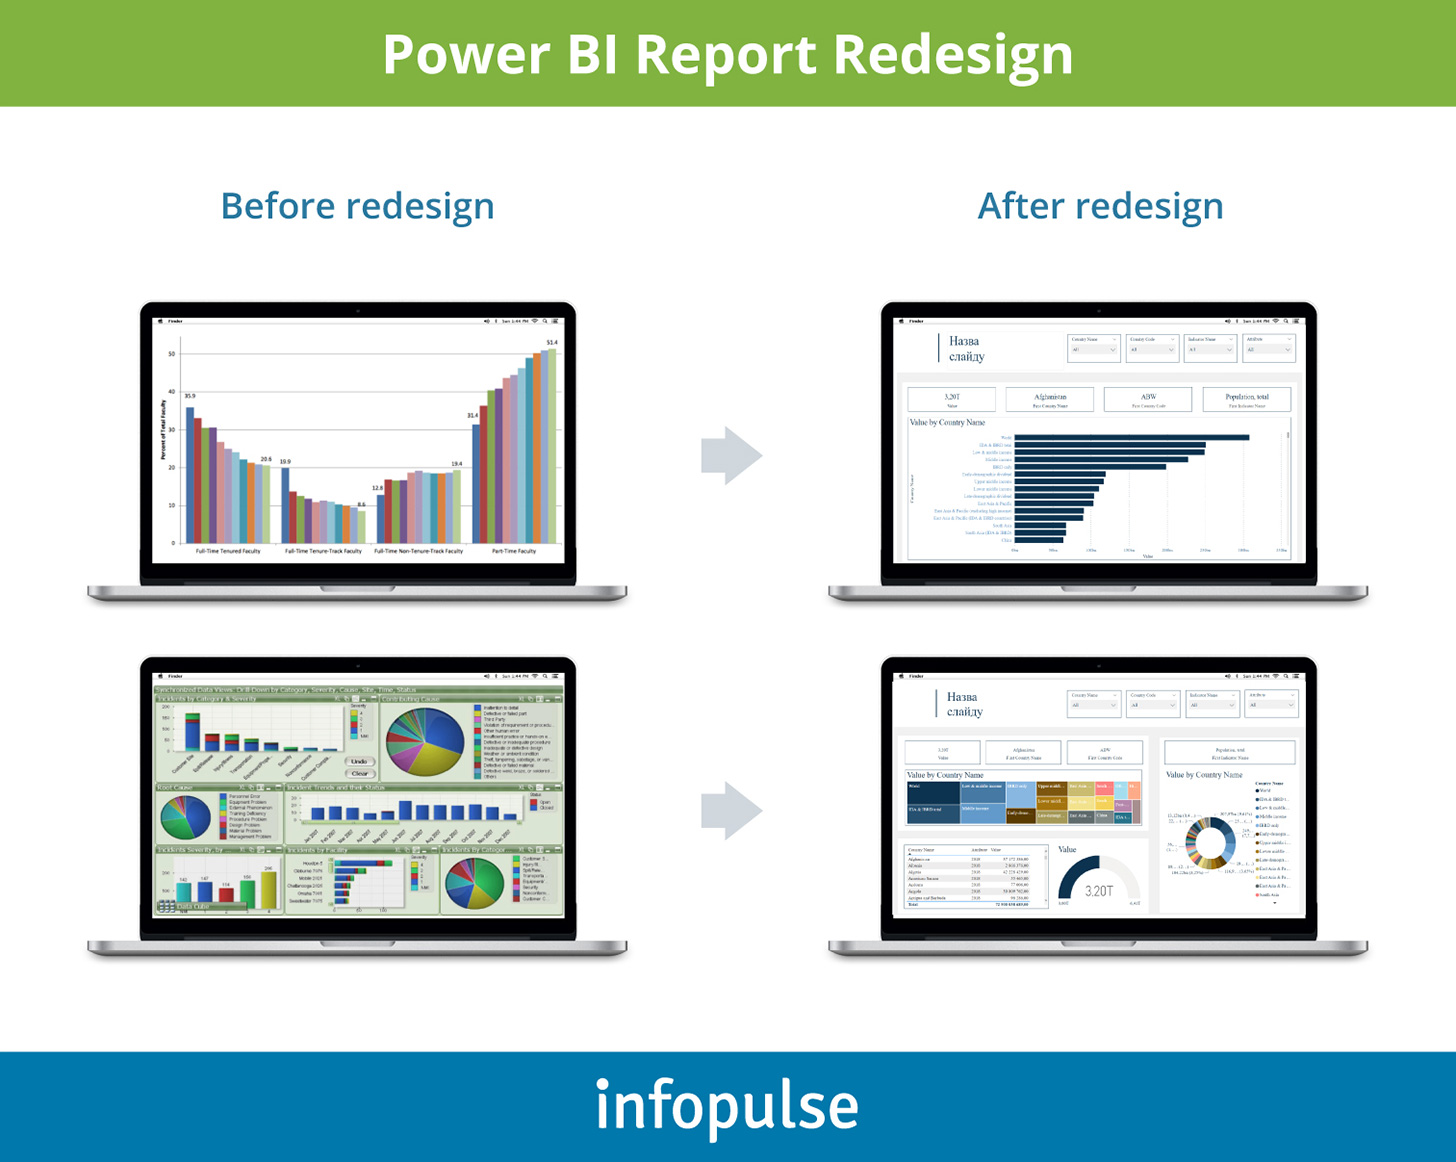
You can also create a branded Power BI dashboard template representing a unified layout with the standardized placement of different elements, such as logo, data filters, etc. - Step 7. Keep it clean and clear. Not all reports are equally effective and insightful. If you look through various Power BI dashboard examples, you will easily notice that the best Power BI dashboards are as simple and clean as possible. Clarity is the goal you should strive for when creating a report.
Also, make sure not to overload your BI dashboard design with data models. Experts recommend creating no more than eight models per report since the abundance of visualization makes it difficult to perceive and digest information.
Let’s compare Power BI report examples.
- Step 8. Allow customization. In addition to wide branding options, the users should be able to customize the reports. For example, Power BI allows you to customize visuals by changing the visualization type, comparing two or more measures, adding or removing a legend, and changing aggregations. Plus, the users can capture, share, and reset their changes.
Data Analysis
Power BI reports become especially beneficial when you analyze them right. Here’s what you should consider leveraging data analysis and insights extraction in Power BI.
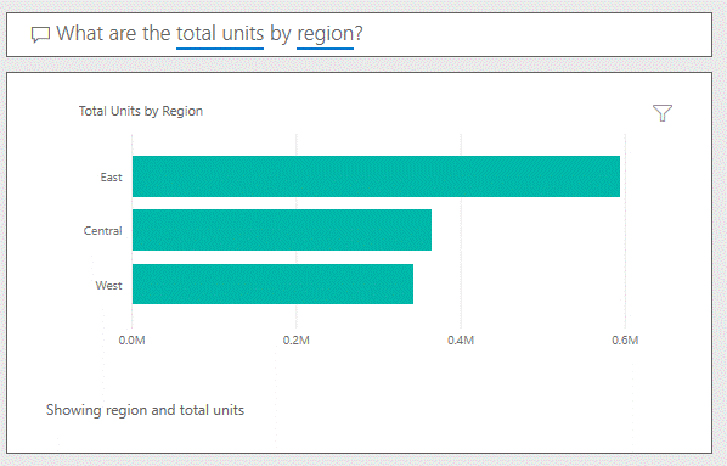
- Step 9. Use Q&A to ensure your report is error-free. Microsoft Power BI is smart and interactive. For example, after generating your report, you can ask a question using natural language processing (NLP) to make sure you got everything right.
- Step 10. Make better decisions with decision intelligence. Decision intelligence is the next step of data analysis software evolution. This is a deep learning-powered system that not only gathers and analyzes the data but also suggests the best decisions based on the previously made ones and historical information.
Conclusion
Power BI reporting and analytics allow extracting actionable insights from your data sets, gathering them from multiple sources in real time. Although Power BI is an intuitive solution, it still needs to be tailored to your specific business needs as in this case, to enable data-driven decision-making. Having an in-depth expertise in Power BI design, Infopulse offers a packaged solution for those who want to make use of a well-thought-out implementation of the platform. We would be happy to help you get started fast with this tool and unlock all the opportunities data analysis and visual reporting can promise! Contact us to find out more about our offerings.
![Pros and Cons of CEA [thumbnail]](/uploads/media/thumbnail-280x222-industrial-scale-of-controlled-agriEnvironment.webp)

![Data Analytics and AI Use Cases in Finance [Thumbnail]](/uploads/media/thumbnail-280x222-combining-data-analytics-and-ai-in-finance-benefits-and-use-cases.webp)
![Data Analytics Use Cases in Banking [thumbnail]](/uploads/media/thumbnail-280x222-data-platform-for-banking.webp)
![Digital Twins and AI in Manufacturing [Thumbnail]](/uploads/media/thumbnail-280x222-digital-twins-and-ai-in-manufacturing-benefits-and-opportunities.webp)

![Big Data Use Cases in Agriculture [thumbnail]](/uploads/media/thumbnail-280x222-key-agro-challenges-solved-by-advanced-data-analytics.webp)

![Manufacturing Trends 2024 [Thumbnail]](/uploads/media/thumbnail-280x222-manufacturing-trends-that-will-shake-the-world-in-2024.webp)