
Project Planning and Monitoring with Team Foundation Server
Regardless of the software development methods and your role (be it a developer, manager or a customer), it is important to keep the project under control. There are many platforms created for the proper tasks organization and monitoring. Discover our insights on Team Foundation Server (TFS) – a Microsoft platform, and your perfect choice for Agile projects.
TFS as a solution for managing the development lifecycle
Team Foundation Server (TFS) is an Application lifecycle management (ALM) product developed by Microsoft Corporation. It offers clear and adjustable tools to plan and monitor projects and individual tasks, making TFS a perfect choice for both Agile Software Development and Waterfall teams.
Organization of the requirements in TFS
All projects begin with planning, i.e., defining requirements and restrictions such as project duration and availability of resources and ending with the release and reporting phases. At the same time, the course of the project development may vary as it largely depends on specifics of methodologies applied and way of their implementation according to the main project requirements. Thus, one of the primary features of Scrum is a Product Backlog, which outlines all future work to be conducted throughout the whole project.
The Product Backlog is a roadmap and storage of all customer’s requirements, expectations, and priorities displayed in a form of User Stories. Each User Story contains a part of the requirements, which can be realized independently. As some projects may contain up to 2,000 User Stories, all tasks are represented in the Requirements Tree to simplify managerial processes.
TFS Requirements Tree consists of Releases, Epics, Features, and Product Backlog Items (Stories).
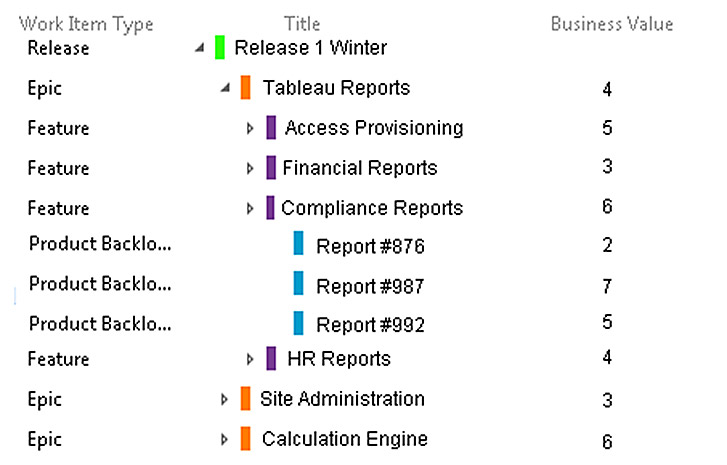
Picture 1: TFS Requirements Tree
Picture 1 shows an ordinary Backlog containing a number of Features, which form a part of Epics. Each Tree Item can have a value in the Business Value field that shows its relative importance in the frame of the whole project. As clients’ representatives with various access rights take part in the project, they frequently influence the Business Value field. The tree structure streamlines requirements search and updates, making it possible to specify the priority level of specific requirements and to present the project scope at different levels. Thus, the customer can check current reports, the supervisor can see features that are currently in the pipeline, and the Director can track the status of the Calculation Engine.
At the planning stage, a project can contain a number of Releases, Features, and Epics, which may be moved flexibly depending on the business priorities, while considering available resources and efforts needed to meet the requirements. As Releases, Features, and Epics generalize the requirements to represent them at different levels and with different details, a User Story is an indivisible unit available for teamwork.
User Story Requirements form a set of criteria, according to which your team can estimate the work scope, deadlines, complexity, and interactions. Please note that refining specification requirements and expectation descriptions always requires a lot of time. A common practice is to cease writing Acceptance Criteria field specifications as soon as the development team gets a clear understanding of a User Story. This implies the team should have the following: experience in realization of similar scenarios; rights to make independent implementation decisions; and ability to make valid estimations of project complexity. That is to say, if the team is already familiar with the terms and definitions of the criteria, and knows where to get the data, there is no need to spend more time on documentation.
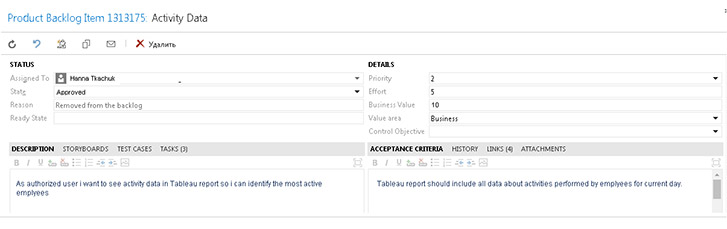
Picture 2: User Story example
Work Scope Estimation
TFS Estimation Fields
Release plan preparation has to be based on the prior experience, understanding of the development speed and complexity estimation.
TFS has a dedicated field for Effort (Complexity) at the levels of User Story, Feature, and Epic. Considering prior experience and requirements, the team can analyze the total complexity of implementing specific functions. The results of the User Story estimation would be similar to those as shown in Picture 3. In this example, we can see how User Stories are allocated on the complexity axis and then grouped into relevant units that can be chosen by each team independently.
It is important to note that Effort (Complexity) is estimated only in relation to other User Stories, and is not measured in working hours. Units of measurement, in this case, are really a matter of preference, and may range from regular units like “Story Points” to some extraordinary ones, like “snakes”, or “lottery tickets”.
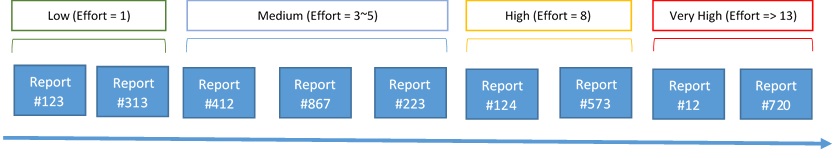
Picture 3: Relative estimation of the User Story
Upon estimating separate User Stories, Effort values can be grouped on the Features and Epics levels. As soon as the team size is fixed, complexity estimation in Scrum becomes regulated by timeframes only. Here the team serves as a carrier of the prior experience with a fixed development speed. By fixed development speed, we imply that the team is able to complete a certain amount of “Story Points” during a cycle of a fixed length. However, this assumption may become a bottleneck when the team is formed from the ground up or is fundamentally changed before the project start.
“Velocity” (development speed) is a statistically defined, albeit somewhat relative value, which measures how fast a team can complete their work. On contrary to some opinions, Velocity is neither a delivery rate, nor a bare minimum. It helps to form a release plan with a room for adjustments and within a certain success probability level.
Picture 4 shows the number of Story Points that were completed by the team within the project delivery during approximately nine months. If we analyze the amount of the work delivered, we can see that after an adaptation period at the beginning of the project the team delivers no less than 110 units per sprint. Nevertheless, one shouldn’t set the bare minimum at 125 units and expect the team to deliver it, motivating them with a “You Can Do It!” approach. Velocity is more of a prediction than of a strict delivery plan.
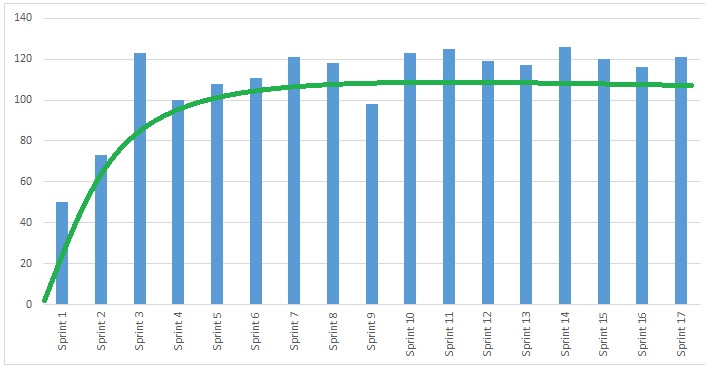
Picture 4: Velocity – delivery rate
Teamwork Scope Estimation
In many real-life scenarios, when the team is new and has no experience in working together, it is impossible to plan release based on the Velocity. In such cases, planning should be based on the uptime of such activities as development, testing and documenting.
Each part of the requirements can be estimated in hours required for their implementation. For this reason, each User Story delivery is divided into separate tasks. See the example in Picture 5 below.
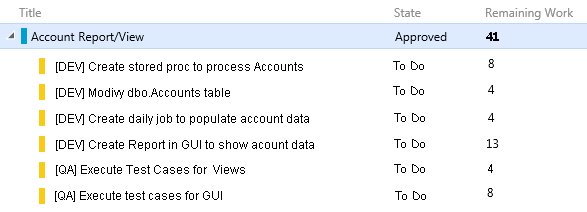
Picture 5: List of tasks in the User Story field
Additionally, TFS has an Activity field at Task level, according to which the tasks are distributed among the groups inside the team. Thus, by estimating teamwork scope, we can consider separately the number of resources required for the frontend, backend, and testing. The Activity field, just like many other TFS fields, is a custom dictionary where we can add or extract values. An example of an Activity Field in an average project can be seen below in Picture 6.
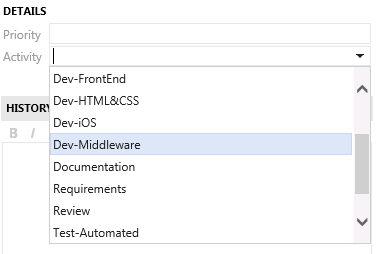
Picture 6: Activity Dictionary at the Task level in TFS
At this stage of scope estimation, tasks and time required to implement them are already known. To balance the tasks with the time available for the team, TFS has a Team Capacity management option. This value is estimated per one sprint level and shows an approximate number of hours committed by all team members, as well as the types of activities they are involved in. A specialist can perform different roles, be a part-time employee, or may take a vacation; and all these values can be specified in Team Capacity Management so that they could be taken into account during the planning stage.
In the following example, we’ll show a common sample of Capacity field and will fill it in. Picture 7 shows settings for a team of 6 people, including an analyst, a designer, a testing engineer and three developers. As we can see, John Doe and Korben Dallas work part-time and are active only three hours per day, while Samwise Gamgee is a technical leader and has to perform Review besides the regular development job. The rest of the team works full-time. As a rule, one hour per an eight-hour working day is allocated for the meetings while the remaining time is contributed to performing ongoing tasks.
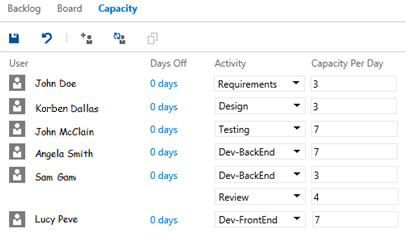
Picture 7: Team Capacity
Now everything is ready to distribute User Stories among the sprints while considering the time required for particular activities instead of the relative complexity values.
TFS automatically determines the balance between the Remaining Work (a value in hours required for all tasks within a sprint) and available Capacity. This ratio is always shown on the operational page of the sprint. The Work section shows the percentage of the sprint time set for regular tasks.
Some common cases are shown in Picture 8 below. For instance, at the beginning of the sprint, it is recommended to save at least 10-15 % of the time for the possible changes and new requirements. At the same time, we can see that testing work scope exceeds the sprint schedule. In this case, the team may negotiate different options with the customer, such as reducing or extending the sprint, finishing QA during the next sprint or involving more specialists for testing, etc. Most importantly, there is an obvious indicator showing the need to carry out such managerial decisions. The capacity is balanced when every team member is in the green zone and has some extra time, and the total aggregated figures of activity types are in the green zone too. These figures should be monitored and supervised on a regular basis.
It’s worth to mention, that it is easy to shift User Stories between the sprints. You can move User Stories to any iteration or to Backlog with all accompanying data and analyze the capacity changes within the sprint with the help of the right-click menu. By deleting bulky User Stories and adding smaller ones, you can optimize the sprint capacity while considering the specifics of each team.
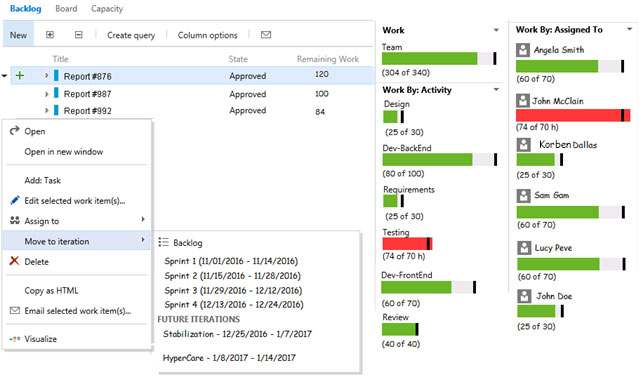
Picture 8: Analysis of a Team capacity at the beginning of the sprint
Team Load Balancing
Defining TFS Users Roles
When analyzing everyday work with TFS, we can define the following roles:
- Developer, tester, designer, and other engineers
- Team leader, scrum master or project manager
- Customer, supervisor or another party with the right to overseer the project
Developers and other service providers
At the beginning of each iteration, every team member receives a specific scope of work that doesn’t exceed his/her time resources. At least 10% of extra time is given to fix possible defects or solve unexpected issues that might occur during the development stage. As we have previously shown, some time during the planning stage was allocated as a resource for the daily tasks.
For a full-time developer, it would be approximately seven working hours per day. When working with TFS, a developer has two extra tasks besides the product development: daily updating of the Remaining Work field for all tasks in progress and updating the status of this task. In fact, these two are the only operations that developer has to do when working with TFS. This means that at the end of the working day all team members need to specify how many hours are left to complete their tasks. When the task is completed, they have to change its status to “Done”. In this case, the work scope given to a certain developer will decrease, putting him in the “green” zone of the capacity & time correlation. The whole team will stay in the green zone if every member has this correlation balanced.
The greatest benefit TFS brings to the developer is a powerful code-controlling platform integrated with Microsoft Visual Studio. Moreover, TFS offers a system to work with the test cases. In some cases, a developer can face unexpected difficulties. In this case, he has to set a new increased value in the Remaining Work field.
Team leaders and Project managers
Providing control is the main responsibility of both a Team leader and a Project manager. TFS contains a number of control tools that work well in real projects. One of them is shown in Picture 9. In this case, the testing engineer was overloaded; the whole case required an urgent attention and a prompt managerial decision. Monitoring the workload of every team member and of the whole team in general is an easy way to track the development status. The capacity lines are always available on the sprint page, with the red color highlighting the task areas that require attention.

Picture 9: Analysis of a Team capacity at the beginning of the sprint
The graph in Picture 10 below shows real changes in the work scope and time available for the work performance (Capacity). The green line features hours reduction needed for the development, and the blue area summarizes Remaining Work for all tasks in the sprint. If the blue graph goes over the green line, the team is behind the deadline. When the blue graph is below the green line, the team is in “green” zone of the capacity & time correlation balance (Capacity). Moreover, this graph allows to observe the project’s tendencies. E.g., even if the team is always in the “green” zone and is not overloaded with tasks, the graph of the remaining works can get closer to the Capacity margin (the green line). This trend might attract manager’s attention as there can be some difficulties that block the teamwork. Thus, the team can soon be behind the schedule.
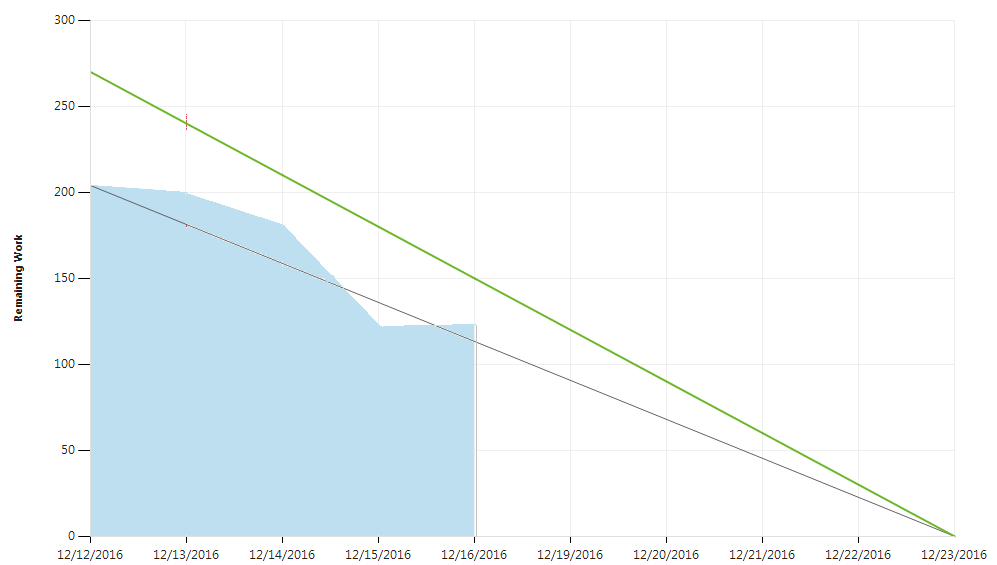
Picture 10: Burndown chart. Time history of the changes in the remaining workload
It is hard to foresee all kinds of reports that may become necessary at different project stages. TFS has an excellent tool that can help you create reports, graphs, and data summaries according to different criteria. By using Query option, we can get any dataset from the tasks, User Stories or any other items that are in progress or already completed. Moreover, based on the same dataset we can create different summary graphs.
For example, Picture 11 shows three graphs generated with the same dataset. This set, resulting from a query, has a table view and can be modified in Results and Editor tabs. With its help, the manager can analyze all current activities in the project, including the workload and task distribution among the team, and much more by generating relevant graphs and data selections.
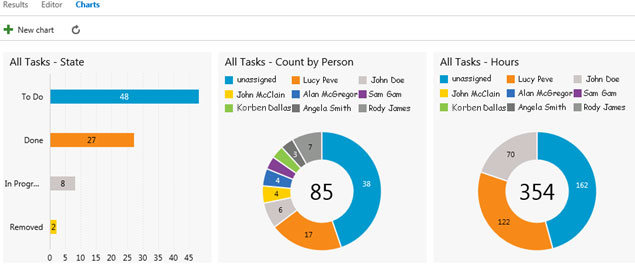
Picture 11: User Query Graphs
Customer, supervisor, and another controlling party
Transparency of the processes and intermediary results, as well as anytime available information, are the key features of the business. It may be difficult to find data you need among all those reports, lists, and documents. Here’s where TFS can help – it has almost limitless Query options. Thus, people with access to the portal of a particular project can easily generate any excerpts and reports they need. With TFS, you can create a personalized Dashboard out of the most frequently accessed information and graphs.
In Picture 12, you can see a Dashboard sample with a number of graphs, which may be of use for future work and monitoring activities. This Dashboard contains main elements to indicate team’s workload and some statistical data. The Dashboard can be extended with additional graphs, charts, and tables depending on the project requirements, needs, and items that require regular monitoring. Thus, one project review window can display all up-to-date information that may be of interest for the customer. If the Dashboard is created due to the managerial decisions or project specifics, there is no need to constantly search for the data, as it is available on the main page of the project. We can also find here the indicators that mark necessity to carry out managerial decisions, optimize the processes, and extend or reduce the team.
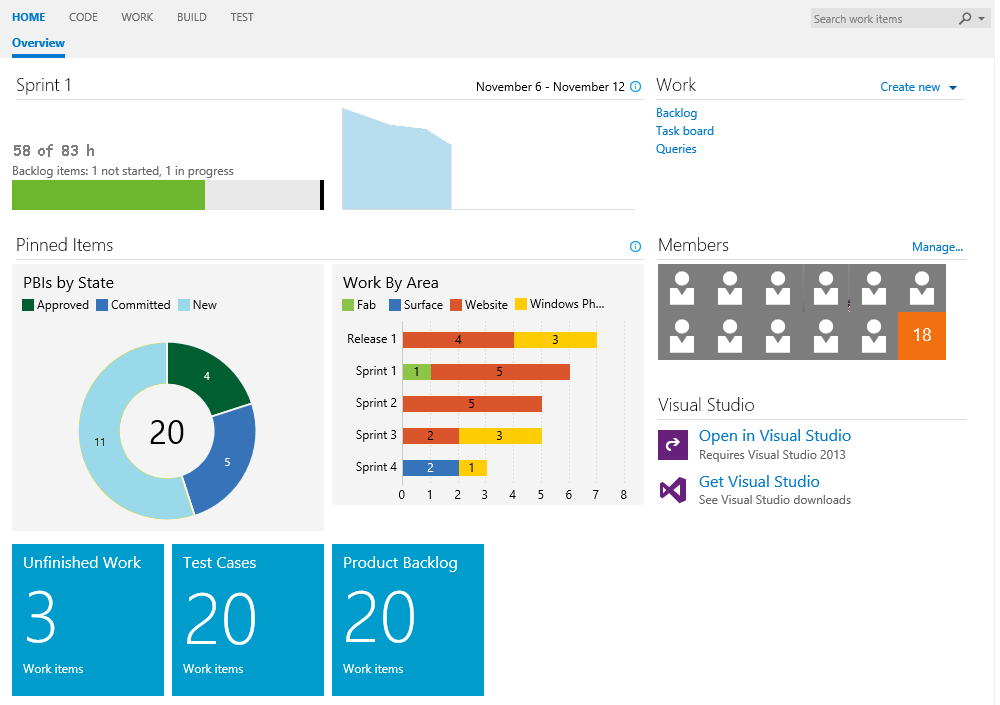
Picture 12: TFS Dashboard
Final Thoughts on TFS
Manager: I use tasks formatting to see available items. TFS can optionally highlight any item based on my specific requirements, such as ‘last updated’ date, dependencies, blocking and more. Additionally, TFS and MS Excel integration is a huge benefit for me! With all that, I can focus on other tasks.
Manager: TFS is really easy to use! I like TFS Scrum Board, which is extremely useful for distributed teams. I can see all status updates immediately. All tasks are already there, and managing them is so effortless!
Technical Leader: TFS is my daily driver. I use it as a source control, task tracker, code review tool – the possibilities are limitless! TFS helps me to get things done in time and present my progress to the customer in a concise and transparent way.
Developer: I can easily track all my activities in TFS and find all information I need. When I work with TFS, I can be sure I am developing according to the schedule.
TFS is a very practical and efficient tool that meets users’ expectations. TFS helps to manage the development process on all participants’ sides and provides a comprehensive control of the project progress.
![Expanding NOC into Service Monitoring [thumbnail]](/uploads/media/280x222-best-practices-of-expanding-telecom-noc.webp)
![Cloud-Native for Banking [thumbnail]](/uploads/media/cloud-native-solutions-for-banking_280x222.webp)
![Data Governance in Healthcare [thumbnail]](/uploads/media/blog-post-data-governance-in-healthcare_280x222.webp)
![Security Levels [thumbnail]](/uploads/media/thumbnail-280x222-levels-of-enterprise.webp)
![ServiceNow and Third-Party Integrations [thumbnail]](/uploads/media/thumbnail-280x222-how-to-integrate-service-now-and-third-party-systems.webp)
![5G Network Holes [Thumbnail]](/uploads/media/280x222-how-to-detect-and-predict-5g-network-coverage-holes.webp)
![DevOps Adoption Challenges [thumbnail]](/uploads/media/thumbnail-280x222-7-devops-challenges-for-efficient-adoption.webp)
![How to Reduce Churn in Telecom [thumbnail]](/uploads/media/thumbnail-280x222-how-to-reduce-churn-in-telecom-6-practical-strategies-for-telco-managers.webp)
![Automated Machine Data Collection for Manufacturing [Thumbnail]](/uploads/media/thumbnail-280x222-how-to-set-up-automated-machine-data-collection-for-manufacturing.webp)
![Azure Monitor for SAP [thumbnail]](/uploads/media/thumbnail-280x222-azure-monitor-for-sap-solutions-an-overview.webp)