
Top 10 Software Development Metrics to Measure Productivity
When equipped with relevant data, a manager can identify project bottlenecks early and effectively, reduce risks, and eliminate failures. Multiple reports have shown that the longer it takes to discover a mistake in the code, the more costly it will be to fix it. The research from Cambridge University Judge Business School MBA states that reproducing bugs is the biggest barrier to fixing bugs faster for 41% of respondents. 56% say it is possible to release software faster if reproducing failures wasn’t an issue.
Measurement also helps you spot scenarios when “things do not add up” due to unclear or conflicting project requirements. According to The State Of Project Management research from Wellington:
- 36% of organizations mostly or always deliver the full benefits of their projects.
- 45% say their organization has a track record of project success.
- 34% of projects were likely to be delivered on time.
- 34% of projects were likely to be delivered on budget.
Why? Managers fail to calibrate their processes and establish productivity metrics for software development that actually tell useful insights about product health and team performance. They also often choose to track too few or too many parameters just to collect some information. The problem with this approach is that it rarely results in truly data-driven decisions and tangible improvements in the development process.
Measurements should only be deployed to answer business questions. They should help your business understand how to deliver maximum value to the end-user. Numbers related to uptime, service availability, and budget adherence are important, but they fail to tell the complete story of your engineering team’s performance and product health.
Gartner reports that 63% of CIOs fail to convey the value of IT to business leaders, too often focusing on technology and operational performance metrics. That is why it’s essential to find the right balance between metrics related to IT performance and business outcomes.
Keeping this measurement balance is hard and choosing the right software development metrics to track is essential for obtaining the desired outcomes.
In the following post, we’ll focus on explaining what software development metrics are, how they can be used to assess and improve different aspects of your agile product lifecycle, and ultimately, how to measure the productivity of your teams and achieve the desired business results.
Who Needs Software Development Productivity Metrics?
The short answer is – companies that want to ship effective software, according to specs on time and within budgets.
By applying measurement to different areas you can identify where change is needed. Measuring soft factors alone can generate new insights into how a certain process operates, how it can be improved and how that improvement will impact your business, e.g., increase lead time-to-market.
Before we dive deeper into measuring application development productivity, let’s define some key terms.
What Is a Metric in Software Development?
A software metric stands for a potential area where measurement can be effectively applied to a certain software module or its specifications. In other words, a metric assumes taking some data from your application development lifecycle and using it for measuring software developer productivity.
It can originate from a single or multiple data source. Any traceable data point can become a metric to measure your team’s performance (though it shouldn’t). Most productivity measuring tools already come equipped with dashboards and analytics units that you can set up to monitor anything and everything.
But do you really need to pay attention to all the available measures, metrics, and indicators in software engineering? Not really.
Oftentimes, managers fall into the trap of relying on some data just because it’s easy to obtain or it is readily available in their tool, e.g., historical per cent of broken builds with a graphic diagram of build times.
In reality, it’s only worth paying attention to whether the last build broke, and how the last few build times varied, rather than try to compare the timeframe to every build that took place during the project.
- You can effectively measure some area of application development or process.
- A relationship exists between what can be measured and what you want to learn.
- This relationship can be validated and expressed in terms of a formula or a model.
The ultimate goal of tracking and leveraging software metrics is increasing productivity in software development.
What Is Software Productivity?
Software productivity can be defined as the ratio between the functional values of software produced to the efforts and expense required for development.
There are many ways to measure productivity, however, most managers use two types of metrics:
- Size-related metrics indicating the size of outcomes from an activity. For instance, the lines of written source code.
- Function-related metrics represent the amount of useful functionality shipped during a set period of time. Function points and application points are the most commonly used metrics for waterfall software development, while story points are the usual metrics for agile projects.
The productivity metrics you choose to track should be:
- Consistent: use clear definitions so the number has meaning.
- Auditable: outsiders can prove the viability of the measures.
- Available: can be used for benchmarking.
- Repeatable: different groups of users will essentially get the same number.
Considering that your development team should be responsible for tracking themselves, settle for metrics that are easy to obtain and communicate. Do not try to track all software development metrics that you can gather. Identify a few areas for team improvement, think which KPIs can represent those areas and collect data to estimate those. Then move on to the next area for improvement.
Business Benefits of Having Software Development Productivity Metrics in Place
The goal behind using precise metrics and measurement in software engineering is to identify and control what can affect software development and the project as a whole. Specifically, using software development metrics contributes to the following:
Precise Project Planning
Project managers and team leads can obtain more insights into the project and predict the possible outcomes with higher precision. For example, they can estimate:
What does each process cost? You can estimate the costs to collect requirements, the cost to specify and design the system, along with the cost to develop and test it. This way you can understand the contribution of each activity to the total project cost and establish better priorities.
Is this process effective? Estimate how frequently and concisely are you delivering new units; assess the effects of new practices or changes, and set targets for process and product improvements.
How can we improve further? You can measure the time it takes to conduct each major development activity and estimate its effect on quality and productivity. Afterwards, you can compare the costs and benefits of certain practices to determine which is worth the cost. Or you can benchmark two different practices to choose a better approach: for example, ask two teams to test different DevOps practices and determine which increases code quality.
Improved Software Developers’ Performance
Productivity metrics for software development clarify performance expectations. Your team remains engaged as they know exactly what is expected of them at work. Metrics communicate your expectations and show you how to measure developer productivity without bias.
Productivity metrics for software development help you identify what factors hinder your team's effectiveness and eliminate those, which would ultimately lead to a happier, high-performing team.
Better Product Outcomes
The combination of the previous factors contributes to simplified workflows and the consistent discovery of new insights that can improve existing product life cycles. You can spot the common bottlenecks, take immediate action and deploy better code faster and at a lesser cost.
The final question is how to measure software productivity. Quantify individual input and pay attention to agile software development metrics that really matter.
List of Key Software Development Productivity Metrics Worth Tracking
You can train your teams to perform their best work fast and effectively, but if your end product is software that works, but does not create any business value, you are pursuing the wrong metrics.
To understand how to measure productivity in software development, you will need to track both business and agile metrics.
- Business/application-specific metrics should tell you how consumers are using your product and whether it’s meeting the market need.
- Agile metrics should measure different aspects of the development process.
Make business success your ultimate metric of productivity measuring. Is your customer happy? Do you deliver on time? How quickly your business results improve? To obtain data-backed answers to these questions you will need to include specific success criteria for each product requirement (e.g., adoption rate by end-user) and map these success criteria to your project’s metrics discussed below.
Metrics to Optimize Software Delivery (1 – 4)
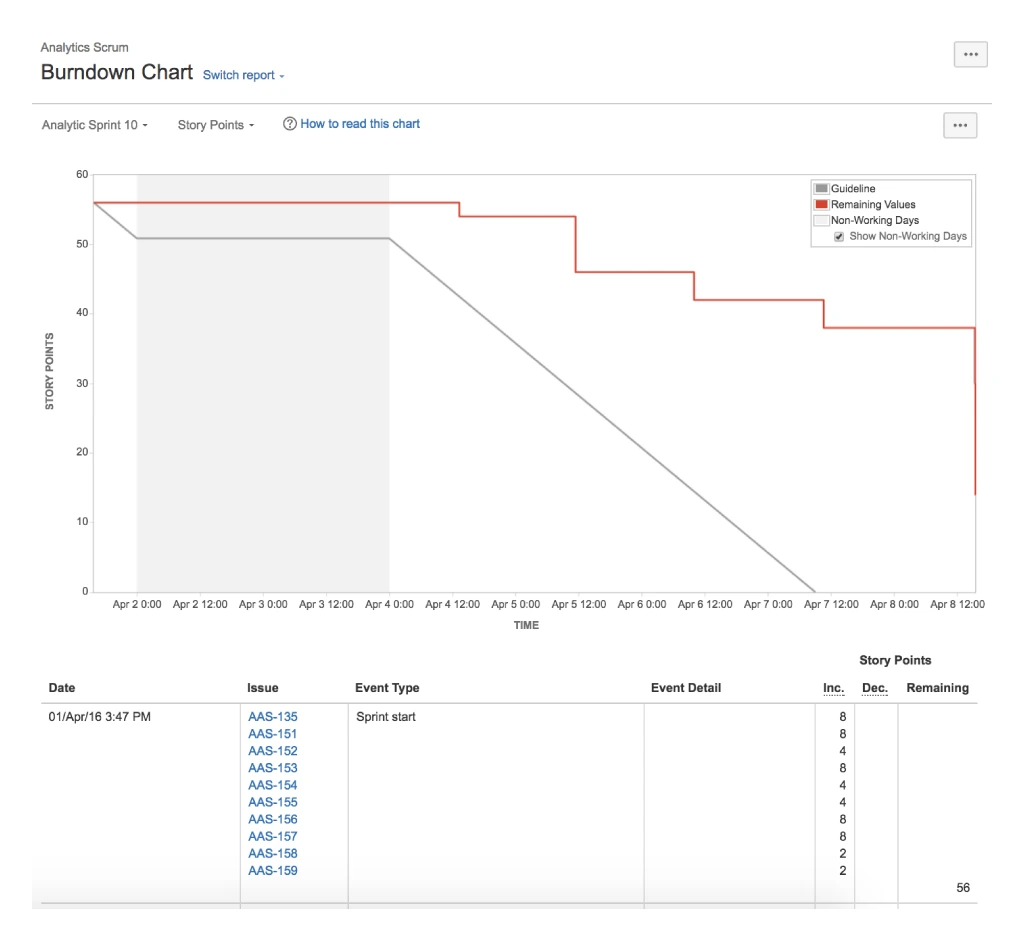
1. Sprint Burndown is one of the key metrics for agile scrum. A burndown report communicates the complexion of work throughout the sprint based on story points. The goal of the team is to consistently deliver all work, according to the forecast.
By tracking this metric you can obtain important insights:
- Consistent early sprint finishes can signify lack of scheduled work for one sprint.
- Consistently missed sprint deadlines, on the contrary, can indicate a gap in your planning and the fact that your team is asked to deliver too much work.
- Your report should feature a steep reduction in “remaining values”, rather than a dramatic drop as the latter will indicate that the work was not assigned in granular pieces.
Sprint Burndown
2. Team Velocity metric accounts for the “amount” of software your team completes during a sprint. It can be measured in story points or hours, and you can use this metric for estimation and planning.
By measuring velocity you can:
- Set better delivery expectations and realistic sprint forecasts
- Understand if your team is blocked (falling velocity)
- Spot unforeseen challenges that were not accounted for during sprint planning
- Investigate if your process changes have any results (stable/increased velocity)
You should also pay attention to the volatility of your velocity. If you score high volatility consistently, it means that some process is now working, and you need to investigate that.
NB: Remember that every team’s velocity metric is unique and should not be used to compare team A and B in terms of performance or productivity. Each team has a specific estimation culture and can have a different interpretation of story points that you should account for.
3. Throughput indicates the total value-added work output by the team. It is typically represented by the units of work (tickets) the team has completed within a set period of time. You should align your throughput metric with your current business goals. If your goal is to release new bug-free modules in this sprint, you should see a large fraction of defect tickets being resolved and so on.
Measuring throughput also helps to:
- Detect when the team is blocked as the throughput metric drops.
- Understand when the team is overloaded if you compare the average throughput against the current workload.
If you want to take it one step further, you can track additional software development performance metrics like:
- Code integrity
- Customer and operation impact of defects
- Date of delivery
- Quality of communication
- System ability to meet service levels
- Cancelled defects that eliminated wasted Q&A time.
4. Cycle Time stands for the total time that elapses from the moment when the work is started on an item (e.g., ticket, bug, task) until its completion.
Cycle Time Metric
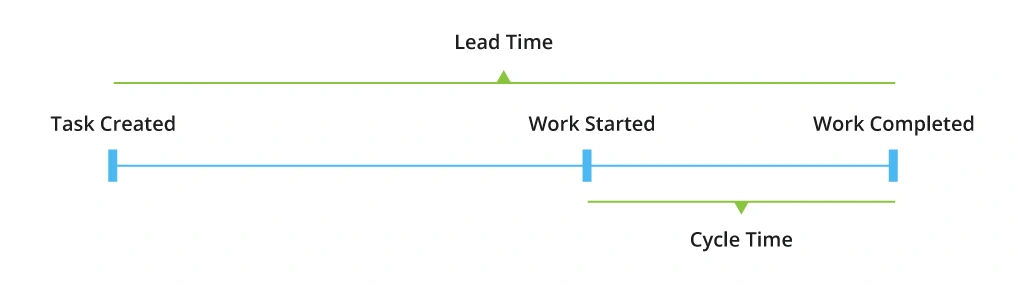
This metric allows you to estimate how fast you can deliver new features to users. It’s also another way to understand your team’s current speed for different tasks by breaking the total throughput down to median time by status or issue type. You can pin down the exact bottlenecks affecting the team’s performance and set more accurate expectations.
For example, by knowing your average bug cycle time you can communicate the right expectations to the users. And by measuring your average feature cycle time, you can manage stakeholders’ expectations and deliver accurate forecasts.
Key Metrics to Measure Software Maintainability (5 – 8)
In the agile approach, maintainability stands for every process that goes into delivering changes to your consumers. If you want to increase deploy times and make code updates easier as part of your Continuous Integration and Continuous Delivery (CI/CD) framework, consider monitoring the next software performance metrics:
5. Lead time – the time between the definition of a new feature and its availability to the user. It helps you estimate how well your team is performing so far.
6. Mean time to repair (MTTR) – how fast can you deploy fixes to the consumers.
7. Code coverage – the amount of code measured in LOC that is covered by a unit test.
8. Bug rates – average number of bugs that are generated as new features are being deployed. It can help you estimate whether you are delivering value or just deploying some half-baked code for the sake of frequent deployments.
Additionally, you may want to gather some common application health statistics to gain more insight into how healthy it is and align your actions with that data. Specifically:
- Error count
- CPU/memory utilization
- Response times
- Transactions
- Disk space
- Garbage collection
- Thread counts
Key Metrics to Measure Your Requirements Effectiveness (9 – 10)
Agile methodology welcomes and accounts for changes at any stage of the project. However, shifting requirements can negatively impact your team’s performance and result in wasted hours and code.
Your goal here is to make sure that your team can work at the consistent pace when presented with both static and dynamic requirements. The following metrics should help you gain some insights into that.
9. Task Volume + average estimates – the number of tasks your team can complete in the face of change, compared against the average estimates will help you understand how consistently your team is completing their work.
10. Recidivism – a high number means someone in the workflow didn’t have the same standard as someone downstream. It is a good indicator of incomplete or inconsistent requirements that you may want to investigate.
Lead time, velocity, and development time – all measure how long it takes for your team to get tasks completed, considering the requirement change.
Conclusion
There’s even more agile software quality metrics you can choose to track. But at the end of the day, you should not get sidetracked from your main goal – deliver value and remain fair to your engineering team and clients.
Every project will have unique complexities and difficulties. While you should establish some baseline software productivity metrics that you will track consistently, do leave them open for discussion with your team and key stakeholders.
![Power Apps Licensing Guide [thumbnail]](/uploads/media/thumbnail-280x222-power-apps-licensing-guide.webp)
![How to Build Enterprise Software Systems [thumbnail]](/uploads/media/thumbnail-280x222-how-to-build-enterprise-software-systems.webp)
![Super Apps Review [thumbnail]](/uploads/media/thumbnail-280x222-introducing-Super-App-a-Better-Approach-to-All-in-One-Experience.webp)
![ServiceNow and Third-Party Integrations [thumbnail]](/uploads/media/thumbnail-280x222-how-to-integrate-service-now-and-third-party-systems.webp)
![Cloud Native vs. Cloud Agnostic [thumbnail]](/uploads/media/thumbnail-280x222-cloud-agnostic-vs-cloud-native-architecture-which-approach-to-choose.webp)
![DevOps Adoption Challenges [thumbnail]](/uploads/media/thumbnail-280x222-7-devops-challenges-for-efficient-adoption.webp)
![White-label Mobile Banking App [Thumbnail]](/uploads/media/thumbnail-280x222-white-label-mobile-banking-application.webp)

![Mortgages Module Flexcube [Thumbnail]](/uploads/media/thumbnail-280x222-Secrets-of-setting-up-a-mortgage-module-in-Oracle-FlexCube.webp)
![Challenges in Fine-Tuning Computer Vision Models [thumbnail]](/uploads/media/thumbnail-280x222-7-common-pitfalls-of-fine-tuning-computer-vision-models.jpg)