![Data Modelling [main banner]](https://www.infopulse.com/uploads/media/banner-1920x528-data-modelling-in-power-bi.webp)
Data Modeling in Power BI: Overview of the Key Approaches
Whether your organization has activated a trial license or completed a larger number of Power BI implementation steps, this guide will serve as a helpful refresher on the Power BI data modeling capabilities.
What Is a Data Model in Power BI?
Let us start with the basics: a data model is a visual representation of different data elements, their interconnections, and their relativity to real-world events.
Data models help organize, group, and assess data from different dimensions to better understand the causal and correlational relationships between different elements, identify repeating patterns, and draw conclusions. Power BI data models help business leaders explore data at different levels of abstraction, using pre-defined business rules for analysis.
Unlike traditional business analytics systems, Power BI offers self-service functionality. The application can be integrated with multiple data sources, originating from other Microsoft business applications (e.g., Dynamics 365), third-party business products (e.g., SAP), or directly from a data warehouse (e.g., Azure SQL databases).
Once the data source(s) are connected, organizations can use pre-made data querying engines and data modeling tools to create custom reports, dashboards, and data models. In other words: business users don’t need to wait for the IT or data science teams to produce the reports. Instead, they can pursue independent data analytics projects, create custom Power BI reports, and uncover impactful business insights faster.
Advantages of Data Modeling in Power BI
Data analysis requires a meticulous approach to defining the relationship between data points or else you risk arriving at the wrong conclusions. The extra challenge is that data can originate from different sources in different formats, which means that not all insights will be readily available for analysis.
Power BI simplifies the process of building usable datasets by improving the discoverability of different assets across the entire data estate. It also provides powerful semantic models for data structuring, tagging, relationship mapping, and curation.
Moreover, Power BI helps establish rules for monitoring data quality, freshness, and completeness. With the optimal database design in the backend, business users can faster obtain access to accurate, reliable, and comprehensive analytics for effective decision-making.
There are several other benefits of Power BI data modeling adopters report.
Centralized Data Access and Data Security
Power BI adoption promotes the creation of a centralized data hub. The underlying architecture establishes a streamlined, secure process for obtaining raw data from various sources; performing data cleansing and transformation, based on the adopted data models; and subsequent dataset publishing for user consumption.
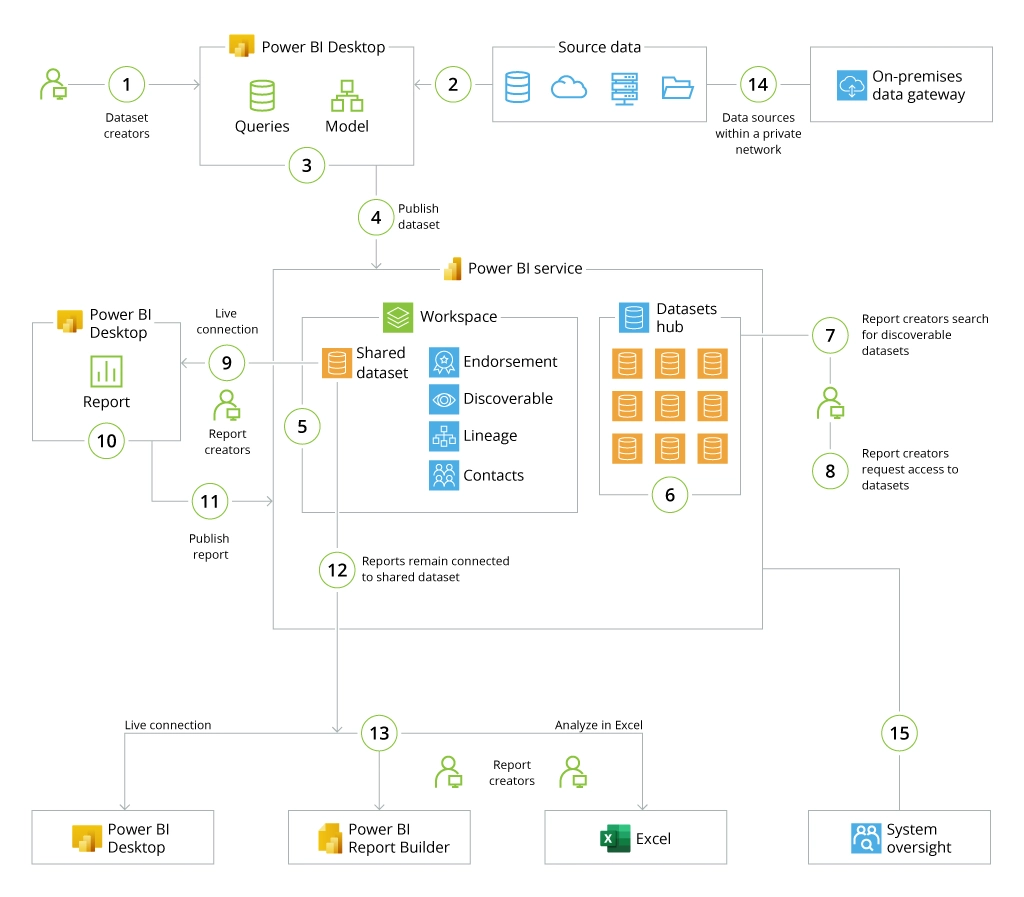
Business users can select pre-made datasets or place requests for new ones. Available datasets can be further analyzed in Power BI Desktop, Power BI Report Builder, or Excel.
Such a setup, where the Power BI service acts as a single source of truth, promotes data integrity, and minimizes error rates, the number of unnecessary data copies, and data redundancy in general.
A centralized data storage (data mart) is also easier to secure. Power BI comes with a host of handy tools for data loss prevention, streamlined governance, and privacy protection. Your security teams can implement service tags, Azure Private Link, and Azure Virtual Network to better protect sensitive corporate data, as well as implement proper access and identity management (IAM) controls with Azure Active Directory.
Democratized Data Access
Data analytics has proven to give a competitive boost to almost every industry: from agriculture to telecom. Machine learning (ML) and deep learning (DL) algorithms can process data at a speed and with such an accuracy, unimaginable for humans.
Power BI provides business users with advanced, yet intuitive capabilities for data modeling and report generation. By empowering users with self-service access to premade datasets, organizations reduce the dependence on IT for report generation and put the data in the hands of more people.
One of our clients, the second-largest alarm company in Europe, scaled access to business analytics to 200 end-users with the help of Azure DWH solution, connected to a Power BI suite. Empowered users can now gain access to business-critical data from 20 data sources in minutes, rather than days, while the company’s IT department can focus on higher-value projects.

Access to the Latest Innovation
Power BI is a SaaS solution. As such users receive automatic weekly and monthly product updates, including access to Microsoft’s latest advancements in AI technology.
For example, Power BI has recently obtained a Copilot mode (currently in preview). Copilot is a generative AI assistant, which allows users to provide descriptive instructions on how to create a data model in Power BI. Copilot can also provide narrated data summaries, ad-hoc calculations, and answer other questions users have about data modeling and report generation.
To accommodate more complex data science projects, Power BI can be connected with Azure analytical services such as Azure Synapse Analytics or Azure Machine Learning. With Azure Machine Learning, Power BI users can design new ML models faster or
embed pre-built ML models into Power BI data flows to obtain enriched insights.
Cost Effectiveness
A proper data warehousing and Power BI architecture increase the speed of data retrieval and subsequent analysis, even when working with large datasets. The self-service experience also reduces the reliance on IT function, which leads to productivity increases both among business and technical users.
The flexible and scalable Power BI data modeling experience also prompts many organizations to retire analytics solutions from other vendors. Forrester reports that larger enterprises achieve $2.3 million in total TCO savings over three years after migrating to Power BI.
That said, smaller organizations can also benefit from a per-user Power BI plan. In contrast to other vendors, Microsoft does not use cross-selling to increase revenue per customer, making Power BI a cost-efficient choice.
Typical Approaches to Power BI Data Modeling
A data model in Power BI is based on the predefined schema design, determined by the data type, data source(s), your domain, and selected use cases.
A schema is a specific structure for organizing data used in a database management system (DBMS). A DBMS can be:
- Relational: hierarchical, network, or object-oriented.
- Non-relational: document data store, column-oriented database, key-value store, document store, or graph-based.
Power BI supports data modeling for both relational and non-relational databases. However, the data modeling process will be somewhat different in each case.
Star Schema
Start schema, also known as dimensional data modeling, is the most widely used data model for relational data warehouses. In this case, data gets organized by two parameters:
- Dimension tables, which describe the modeled assets (e.g., people, products, places, etc). Each dimension table contains a key column (or columns) that serve as a unique identifier, and descriptive columns.
- Fact tables contain observations or events (e.g., temperature, price, exchange rate, etc). A fact table has key dimension columns that relate to dimension tables, and numeric measure columns.
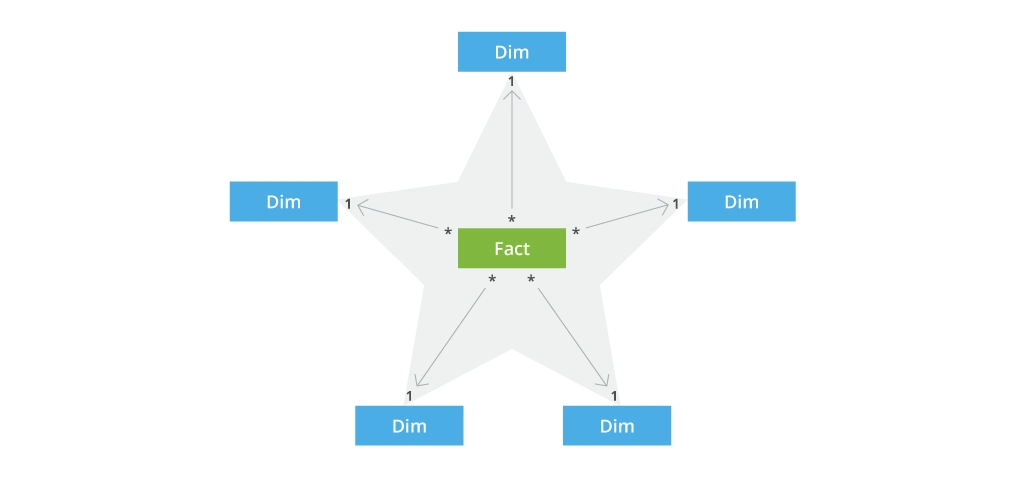
Star schema helps create data models in Power BI, which are optimized for performance and usability. Dimension tables help filter and group data, while fact tables support summarization.
Snowflake Schema
Snowflake schema is a variation of the star schema in Power BI. It helps display more complex data relationships within dimension tables, while also maintaining the data correlation to the central fact table.
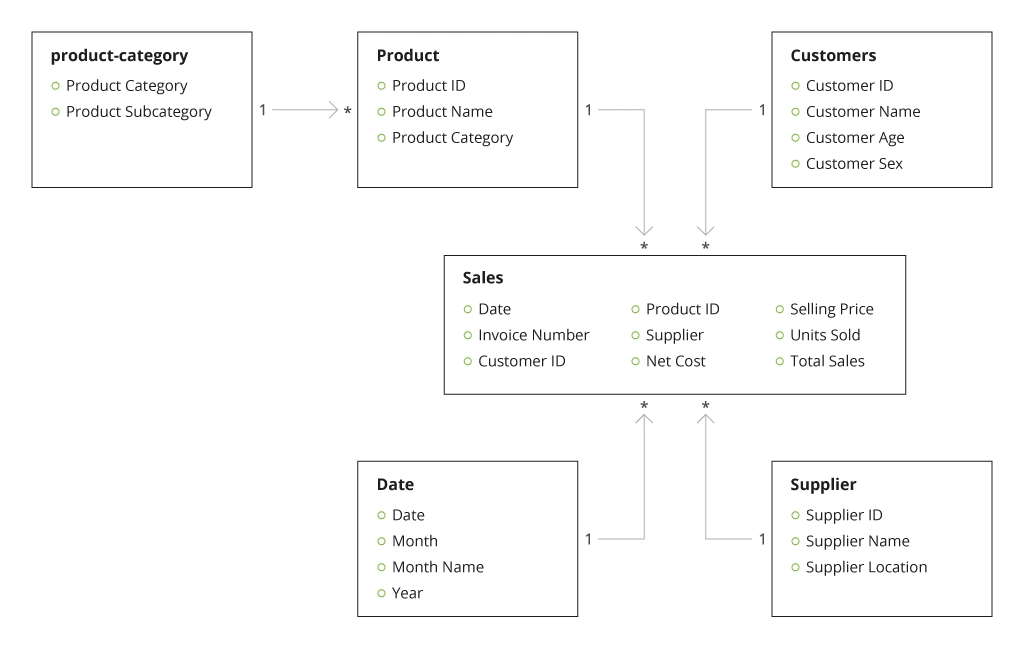
In this case, you have one data dimension, which is no longer linked to a fact table. In this case, the data is more normalized, i.e., stored in a way that reduces repetition.
Although snowflake schema can improve data consistency and minimize the need to create multiple model tables, there are some downsides in performance to account for. In such a design, Power BI loads more tables (that can include multiple columns), which increases the model size and respectively slows down its performance. This can have a tangible impact if you are working with larger datasets. The querying engine will also need to traverse a longer relationship filter propagation chain, which can also have speed tradeoffs. There is also no way to create a hierarchy that spans multiple tables in Power BI.
Data Models for Accessing Data
Data model design in Power BI will also differ depending on the approach you use for accessing connected data sources. Businesses can choose to go with either of the following data access models for Power BI:
DirectQuery Model
DirectQuery mode creates a data pipeline between Power BI and the target source of analytics such as a relational database service like Microsoft SQL Server, Amazon Redshift, Azure Data Bricks, Azure SQL Database, SAP HANA, and Google BigQuery among others. Data remains in the database, while Power BI creates a semantic layer for handling queries and visualization requests.

Benefits:
- No limits on database table sizes for Power BI analytics
- Access to real-time data from the source
- Requires minimal memory for metadata load
- Allows users to apply visualization, report filters, and slicers to the latest data
Limitations:
- Does not allow concurrent data integrations from multiple sources
- A maximum of 1 million rows can be returned on any query
- Can be prone to performance bottlenecks on the SQL Server
Composite Model
A Power BI Composite model allows you to support both direct data imports from multiple sources and DirectQuery mode. A table storage can be configured as Import, DirectQuery, or Dual mode, in which Power BI auto-determines the most efficient approach for obtaining data.
Also, when you use DirectQuery in a composite model, you can choose to combine data from one or more DirectQuery sources or from DirectQuery sources and import data in a single Power BI Desktop file, which is handy for performance optimization.
Benefits:
- Establish many-to-many relationships with tables
- Reduce backend load with storage mode
- Live connection mode gives faster performance than DirectQuery
Limitations:
- Does not support multi-dimensional model for Azure Analysis Service
- Requires a higher degree of relationship granularity
Tabular Model
Power BI also supports tabular models for SQL Server Analysis Services — databases that run in-memory or in DirectQuery mode. In this case, you get access to Analysis Services VertiPaq analytics engine, which applies state-of-the-art compression algorithms and multi-threaded query processors to optimize data processing in tabular model objects. This way organizations can make large tabular datasets accessible to applications like Power BI and Excel.
Alternatively, DirectQuery can be also configured for tabular datasets, which are too large to process in memory. DirectQuery can deliver equally robust performance and row-level security via DAX expressions, as well as query optimizations for faster processing.
Benefits:
- Scalable, high-performance connection for tabular data, hosted in Azure Analytics services or on-premises SQL server analysis services
- Allows blending data from different sources
- Tabular cubes in Analysis Services can be defined using relational databases with free form aggregated tables or using Dimensional data models
- Supports multi-level attribute hierarchies
Limitations:
- Models larger than 250 MB can only be processed on-premises via the Analysis Services Connector
- Primarily use single-threaded processing, which can slow down the performance of larger models
Conclusion
Power BI is a stout and scalable business analytics tool that brings data closer to consumers. To maximize the value from adopting it, create data models, based on the selected use cases and available data times.
Remember: complexity will often mean tradeoffs in performance. Optimize your data model layout based on the speed and latency requirements. Likewise, try to simplify data relationships by using simpler schemas to accelerate model performance.

![Power BI Plan [thumbnail]](/uploads/media/thumbnail-280x222-a-step-by-step-power-bi_.webp)
![Big Data Platform on AWS [thumbnail]](/uploads/media/thumbnail-280x222-aws-data-platform-20230227.webp)
![Migration to Power BI [thumbnail]](/uploads/media/thumbnail-280x222-a-guide-to-power-bi-igration-5-stages-to-follow.webp)
![Big Data Platform on Google Cloud Platform [thumbnail]](/uploads/media/thumbnail-280x222-why-your-big-data-platform-should-reside-on-google-cloud.webp)
![Data Platforms on Azure [thumbnail]](/uploads/media/thumbnail-280x222-building-data-platforms-microsoft-azure.webp)
![Cloud Data Platforms [thumbnail]](/uploads/media/how-a-cloud-data-platform-helps-unveil-the-outmost-value-of-data-280x222.webp)
![Cloud Data Platforms [thumbnail]](/uploads/media/the-many-faces-of-cloud-cata-platforms-280x222.webp)