![Migration to Power BI [banner]](https://www.infopulse.com/uploads/media/banner-1920x528-a-guide-to-power-bi-igration-5-stages-to-follow.webp)
A Guide to Power BI Migration: 5 Stages to Follow
Here’s where Power BI from Microsoft comes into play. Whether you’re just planning to integrate analytics into your business or have decided to reinforce an existing business intelligence platform, Power BI is the platform of choice.
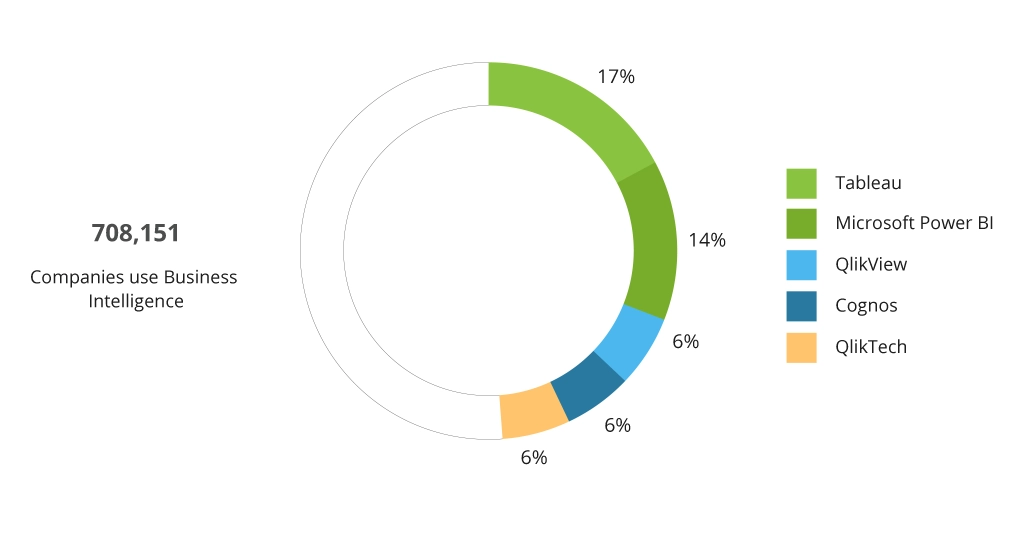
The market analysis reveals that Microsoft Power BI is one of the most popular business intelligence products — as of this writing, 14% of respondents are using it to achieve their sales and marketing goals.
Market Share of Business Intelligence Products
Moreover, Power BI was named a leader in the 2022 Gartner Magic Quadrant for the 15th consecutive year.
Why is this platform the go-to option? Read this Power BI guide to find out the platform’s key benefits and implementation best practices.
Why Migrate: Key Benefits of Power BI
Flexible System Integration
Microsoft Power BI is built on the Azure cloud that is known — alongside scalability and reliability — for its flexibility.
That means you can easily connect the platform with Excel, Microsoft Teams, and other solutions. Advanced BI reporting, conversely, can not only be integrated with Microsoft Azure cloud solutions, but also with other cloud data warehouses, on-premises databases, and third-party systems.
Cutting-Edge Visualization
Fueled by low-code to no-code features, the analytics capabilities that Power BI offers are highly accessible for employees. And with self-service analytics in place, decision-makers can make game-changing decisions much faster.
Moreover, Power BI Desktop is updated once a month to release both minor and major changes in data connectivity, modeling, reporting, and visuals, as well as introduce improvements in troubleshooting, support, infrastructure performance, and more. Microsoft also incorporates user feedback to improve visualizations, allowing users to filter reports and dashboards according to specific metrics, make adjustments in real time, and get new filter requirements updates.
A case in point: Infopulse helped a large international food and agro-tech company that comprises over 30 enterprises revamp their grain balance calculations through Power BI. As a result, users were able to access any calculation and its version to analyze, check, filter, compare, and adjust the data. This allowed the companies to optimize grain operations like harvesting, transportation, storage, and measurement — in turn bringing the entire agricultural productivity to a new level.

Cost-Effectiveness
The Power BI platform can be downloaded as a free demo trial. Monthly subscriptions vary from $10 to $20, depending on whether you want to unlock premium big data and AI features.
Despite such a modest price, the service is of the utmost quality. In turn, such an affordable cost vs quality ratio gives you total cost of ownership (TCO) optimization.
Real-Time Data Access
Once the data is pushed into the system, it is converted into interactive visuals and dashboards so that you can process and analyze it in real time. Such impressive speed in terms of data processing and updates gives you a serious competitive advantage — not only in unlocking value-rich insights, but also in quickly solving issues, identifying future opportunities, and efficiently handling time-sensitive data.
Anywhere, Anytime, Any-device Access
With a reliable internet connection, you can work with data at the office, in a client meeting, from home, or even on the go. Namely, you can take your data with you on the mobile app of choice — whether iOS, Android, or Windows. All the visualizations are optimized to a smaller screen and can be easily accessed even by non-tech savvy users.
Effective Collaboration
Power BI provides advanced collaboration functionality for effective teamwork. All the dashboards can be shared within a workspace, meaning employees can co-own and simultaneously work on the same reports.
Moreover, all users get instant notifications when a new report is generated and can access it at once — whether through the platform itself, a link embedded into an external website, or Outlook.
Rock-Solid Data Security
Data protection is “the must-have of all the must-haves” in any business, and when it comes to sensitive data on employees, revenue, in-house strategies, know-how, and more, its importance grows exponentially.
The Power BI platform deploys its comprehensive cloud-based security and protects outbound connectivity through Azure VNet connectivity. Among other industry-leading data security capabilities are sensitivity labeling, end-to-end encryption, and real-time access monitoring.
Five Stages of Power BI Migration: Our Complete Guide
If you’ve already made up your mind on migrating your data assets from your legacy platform to Microsoft Power BI, here’s the plan on how to conduct the migration.
Migrating BI Assets to Power BI
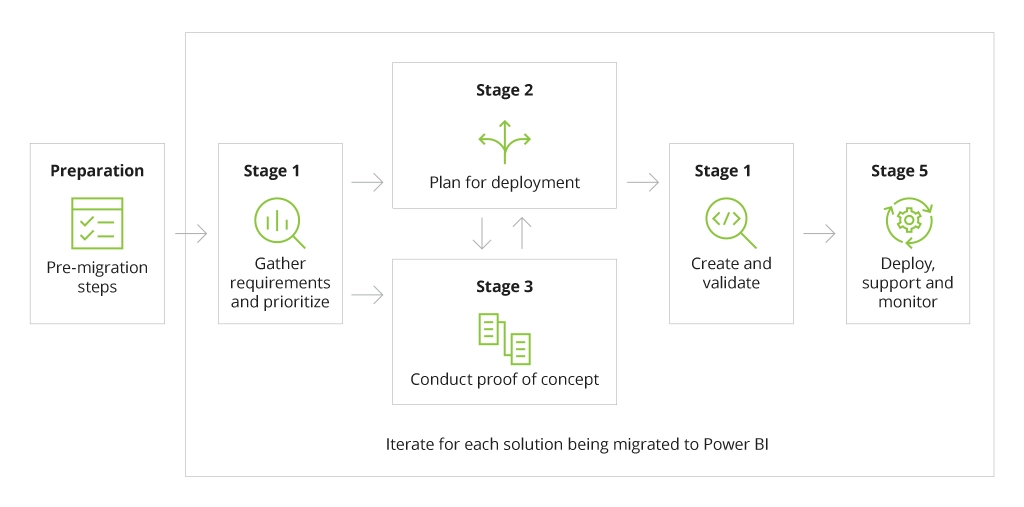
Before proceeding to the five key stages of migration, it’s vital to implement pre-migration steps:
- Cost vs benefit analysis and evaluation
- Identification of stakeholders and executive support
- Initial governance model generation
- Initial deployment planning
- Initial architecture establishment
- Identification of success criteria for migration
- Preparation of inventory of existing reports
- Implementation of partial automation.
Once these initial steps have been put into action, you can proceed to the following stages of actual migration.
The most complete cloud migration manual — a whitepaper you should read when moving to the cloud.
Stage 1: Requirements Gathering and Prioritization
This stage is self-explanatory. It’s an iterative process, during which you compile requirements and prioritize them for future migration. In such a way, you understand the state of the existing BI items and analyze which ones should be altered or refactored in the upcoming Power BI platform.
As for reports requirements gathering, be ready to compile information like the purpose, audience, and expected action. Analyze how users interact with reports to understand which elements can be eliminated or improved in the new system. Identify who will own particular reports and who will be the subject-matter experts (SMEs) responsible for change management, approvals, and sign-offs.
Consider the optimal options for interactivity, report exporting and delivery, calculations, KPIs, and business rules. Define visualization usability and layout needs, sorting and grouping requirements, and BI considerations.
Among other key steps at this stage is security requirements analysis. Here, you should clarify role-based access, data sensitivity and privacy, and regulatory and compliance needs. Also, be ready to determine possible risks, concerns, and known issues.
Data requirements compilation and prioritization demands the same level of precision and urgency as reports requirements identification. The key aspects for work here include:
- Existing reports queries
- Data source types
- Data structure and cleansing
- Data integration
- Data volume, scalability, and latency
- Master data and data catalog
- Security and privacy.
Other significant steps at this stage comprise identifying improvement opportunities around workflow efficiency, data model centralization, reports consolidation, as well as complexity assessment and prioritization.
A case in point: Infopulse helped a leading duty-free operator in Ukraine improve financial data management, processing, and visualization with Microsoft SQL-based DWH and Power BI data analytics — resulting in resource efficiency, an increase in cross and up-sales, and enhanced decision-making.

Stage 2: Deployment Plan
After all the requirements have been analyzed and prioritized, you can use them to create an iterative, non-linear deployment process.
One of the first steps is to choose between Power BI service and Power BI Report Server. Microsoft suggests implementing one of these products, because they’re more reliable in terms of security, content distribution, and collaboration — as opposed to Power BI Desktop, for example.
Then, it’s important to decide on the workspace management approach: whether a new workspace is needed, whether a single workspace will be sufficient for data and reports or if you’ll require separate workspaces, and what are the security requirements for them.
Next up: How will the content be consumed? Through a Power BI app, enterprise tools (like Teams, SharePoint Online, corporate portal), or mobile devices? It’s up to you to decide.
At stage 2, you’ll also have to set up the rules on content creation by platform users, define the data acquisition method, analyze the need for premium capacity, decide where the content will be stored, and evaluate the level of effort necessary for completing the next steps.
Stage 3: Proof of Concept Creation
As opposed to the software development paradigm where the proof of concept (PoC) might be a workable solution, in the migration process it’s more about validating assumptions as well as identifying and addressing unknown risks.
One of the most important steps here is to define PoC goals and scope; namely, validate initial requirements, detect any issues with data, test data source connectivity, verify all functionality and security configurations, and experiment with the layout and other design-related decisions.
The PoC creation stage also includes handling differences in Power BI, redesigning the data architecture if needed, and deciding how to handle dashboard conversions.
Stage 4: Content Creation and Validation
This stage is all about converting the proof of concept to a production-ready solution while implementing the lessons learned from the PoC development stage. And — if time permits — engaging people responsible for the very development.
If an existing Power BI dataset doesn’t meet your needs, you can enhance it or develop a new one by:
- Acquiring data from one or more data sources
- Shaping, combining, and preparing data
- Building an optimal dataset model
- Checking model relationships
- Defining measures
- Implementing row-level security.
The next step is to develop new reports and dashboards while choosing the best data visualization tools, using concise and business-friendly terminology, as well as addressing interactivity requirements.
Another essential aspect is to validate the production-ready solution in terms of data accuracy, security, functionality, and performance.
Stage 5: Deployment, Support, and Monitoring
The final stage of the migration process revolves around making the solution ready for use.
For this to happen, first deploy the solution to the test environment and conduct user acceptance testing. Only after doing so should you proceed to deploying to the production environment and conducting a retrospective.
To reduce the risk of losing mission-critical reports, run the new solution in parallel with the legacy one for a certain period of time. This is usually 30-90 days, until all involved users get accustomed to the new solution. After that, you can decommission legacy reports.
After the migration has been successfully accomplished, monitor the solution. Namely, control activity logs, content updates, new subscriptions, and other important aspects. As your business grows, the migration solution might require adaptive changes. That is why post-migration support is a must — whether internal or external.
A case in point: Infopulse helped a security company migrate to a modern, flexible, and scalable DWH on Microsoft Azure and implement intelligent analytics using Power BI — successfully enhancing operational efficiency, expanding solution capacity, and increasing information security.
Conclusion
The migration to Power BI is an effort-heavy and time-consuming process with many distinct peculiarities. To make sure the transition goes smoothly, consider acquiring the professional assistance of an experienced Microsoft Power BI partner who will analyze your unique business case and specific needs, prepare a detailed migration strategy tailored to your niche, and implement the migration — while simultaneously minimizing all possible risk, optimizing TCO, and providing post-migration support.

![Generative AI and Power BI [thumbnail]](/uploads/media/thumbnail-280x222-generative-AI-and-Power-BI-a-powerful.webp)
![Data Governance in Healthcare [thumbnail]](/uploads/media/blog-post-data-governance-in-healthcare_280x222.webp)
![AI for Risk Assessment in Insurance [thumbnail]](/uploads/media/aI-enabled-risk-assessment_280x222.webp)
![IoT Energy Management Solutions [thumbnail]](/uploads/media/thumbnail-280x222-iot-energy-management-benefits-use-сases-and-сhallenges.webp)

![Carbon Management Challenges and Solutions [thumbnail]](/uploads/media/thumbnail-280x222-carbon-management-3-challenges-and-solutions-to-prepare-for-a-sustainable-future.webp)

![Automated Machine Data Collection for Manufacturing [Thumbnail]](/uploads/media/thumbnail-280x222-how-to-set-up-automated-machine-data-collection-for-manufacturing.webp)